Classifying Vowels from Their Formants
A rule-based classifier that sat near chance until LPC and Mahalanobis distance took it to 88%
What
Five vowels, twenty-five recordings, and the question of whether you can tell them apart from frequency alone. Each vowel carries a distinctive signature in its formants — the resonances of the vocal tract — and the project was to pull those out with a DTFT and build a rule that classifies on them.
The dataset used multiple voices, five recordings per vowel, deliberately so that the result would not just be a model of one person's accent.
How
Preprocessing turned out to be most of the work. Raw recordings carry four problems, and each got its own technique:
- Speaker volumes vary, which distorts the DTFT amplitudes — fixed by normalisation.
- Low frequencies are naturally high-energy and high frequencies naturally low-energy — fixed with a pre-emphasis filter that attenuates change at low frequency and emphasises it at high frequency.
- Noise outside the speech spectrum — fixed with a bandpass filter limited to 60–5000 Hz.
- Silence — fixed with a trimmer that splits the signal into 20 ms buffers and keeps only those whose energy exceeds 2% of the total energy of the normalised signal.
Spectra and peaks. Each cleaned signal goes through the DTFT for its magnitude spectrum, and peaks are taken as anything above 4% of total amplitude and at least 50 Hz from its neighbour — the separation is what stops one formant being counted several times. The resulting F1/F2 bands separate the vowels cleanly: A at 686–786 Hz and 1180–1312 Hz, E at 400–490 and 1830–2168, I at 285–326 and 1874–2445, O at 470–673 and 808–1086, U at 307–398 and 686–974.
The classification is where it got interesting. Peak-distance comparison, frequency-range comparison and F1/F2 ratios all produced roughly nothing — near 0% accuracy, and the correct answers were mostly luck. A weighted average using frequency and magnitude reached 40–44%, which is better but nowhere near "correctly classify most vowels".
What worked was changing the features and the metric rather than tuning the rules: LPC to extract F1 and F2, and Mahalanobis distance to classify against each vowel's own distribution rather than a fixed range.
Outcome
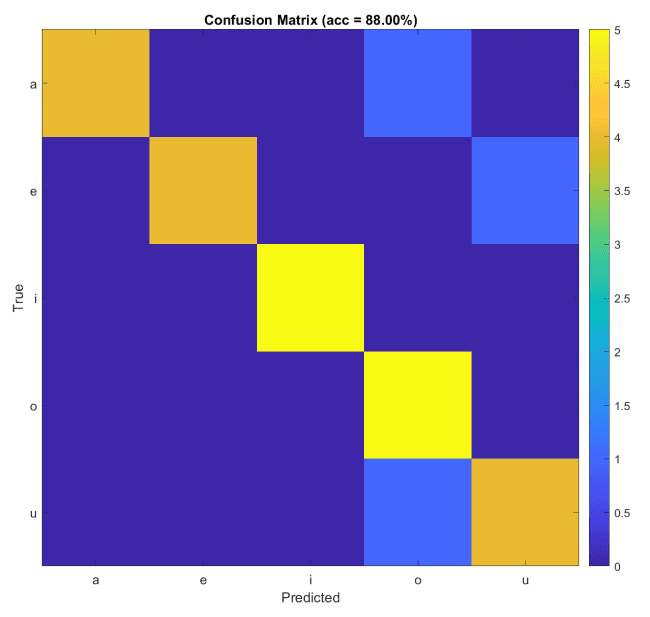
88% accuracy on the labelled set — in the 80–95% band you would expect from LPC plus Mahalanobis, and enough to make the confusion matrix diagonal-dominant. The extracted F1 and F2 values also line up with published vowel formant data, which is the better evidence that the features are real and not an artefact of the recordings.
One result we did not expect: adding more recordings made it worse. Growing the dataset by another four or eight files moved the class centroids and changed the covariances, and the Mahalanobis classifier lost accuracy. We kept the 25-recording set — the one whose formants sat closest to the published values — and said so, rather than quietly reporting the best number.
Pushing past this would mean leaving rule-based methods for deep learning, where
95% is the expectation. That was outside the project's remit, and naming the ceiling felt more useful than pretending there wasn't one.
Gallery
Click any image to enlarge